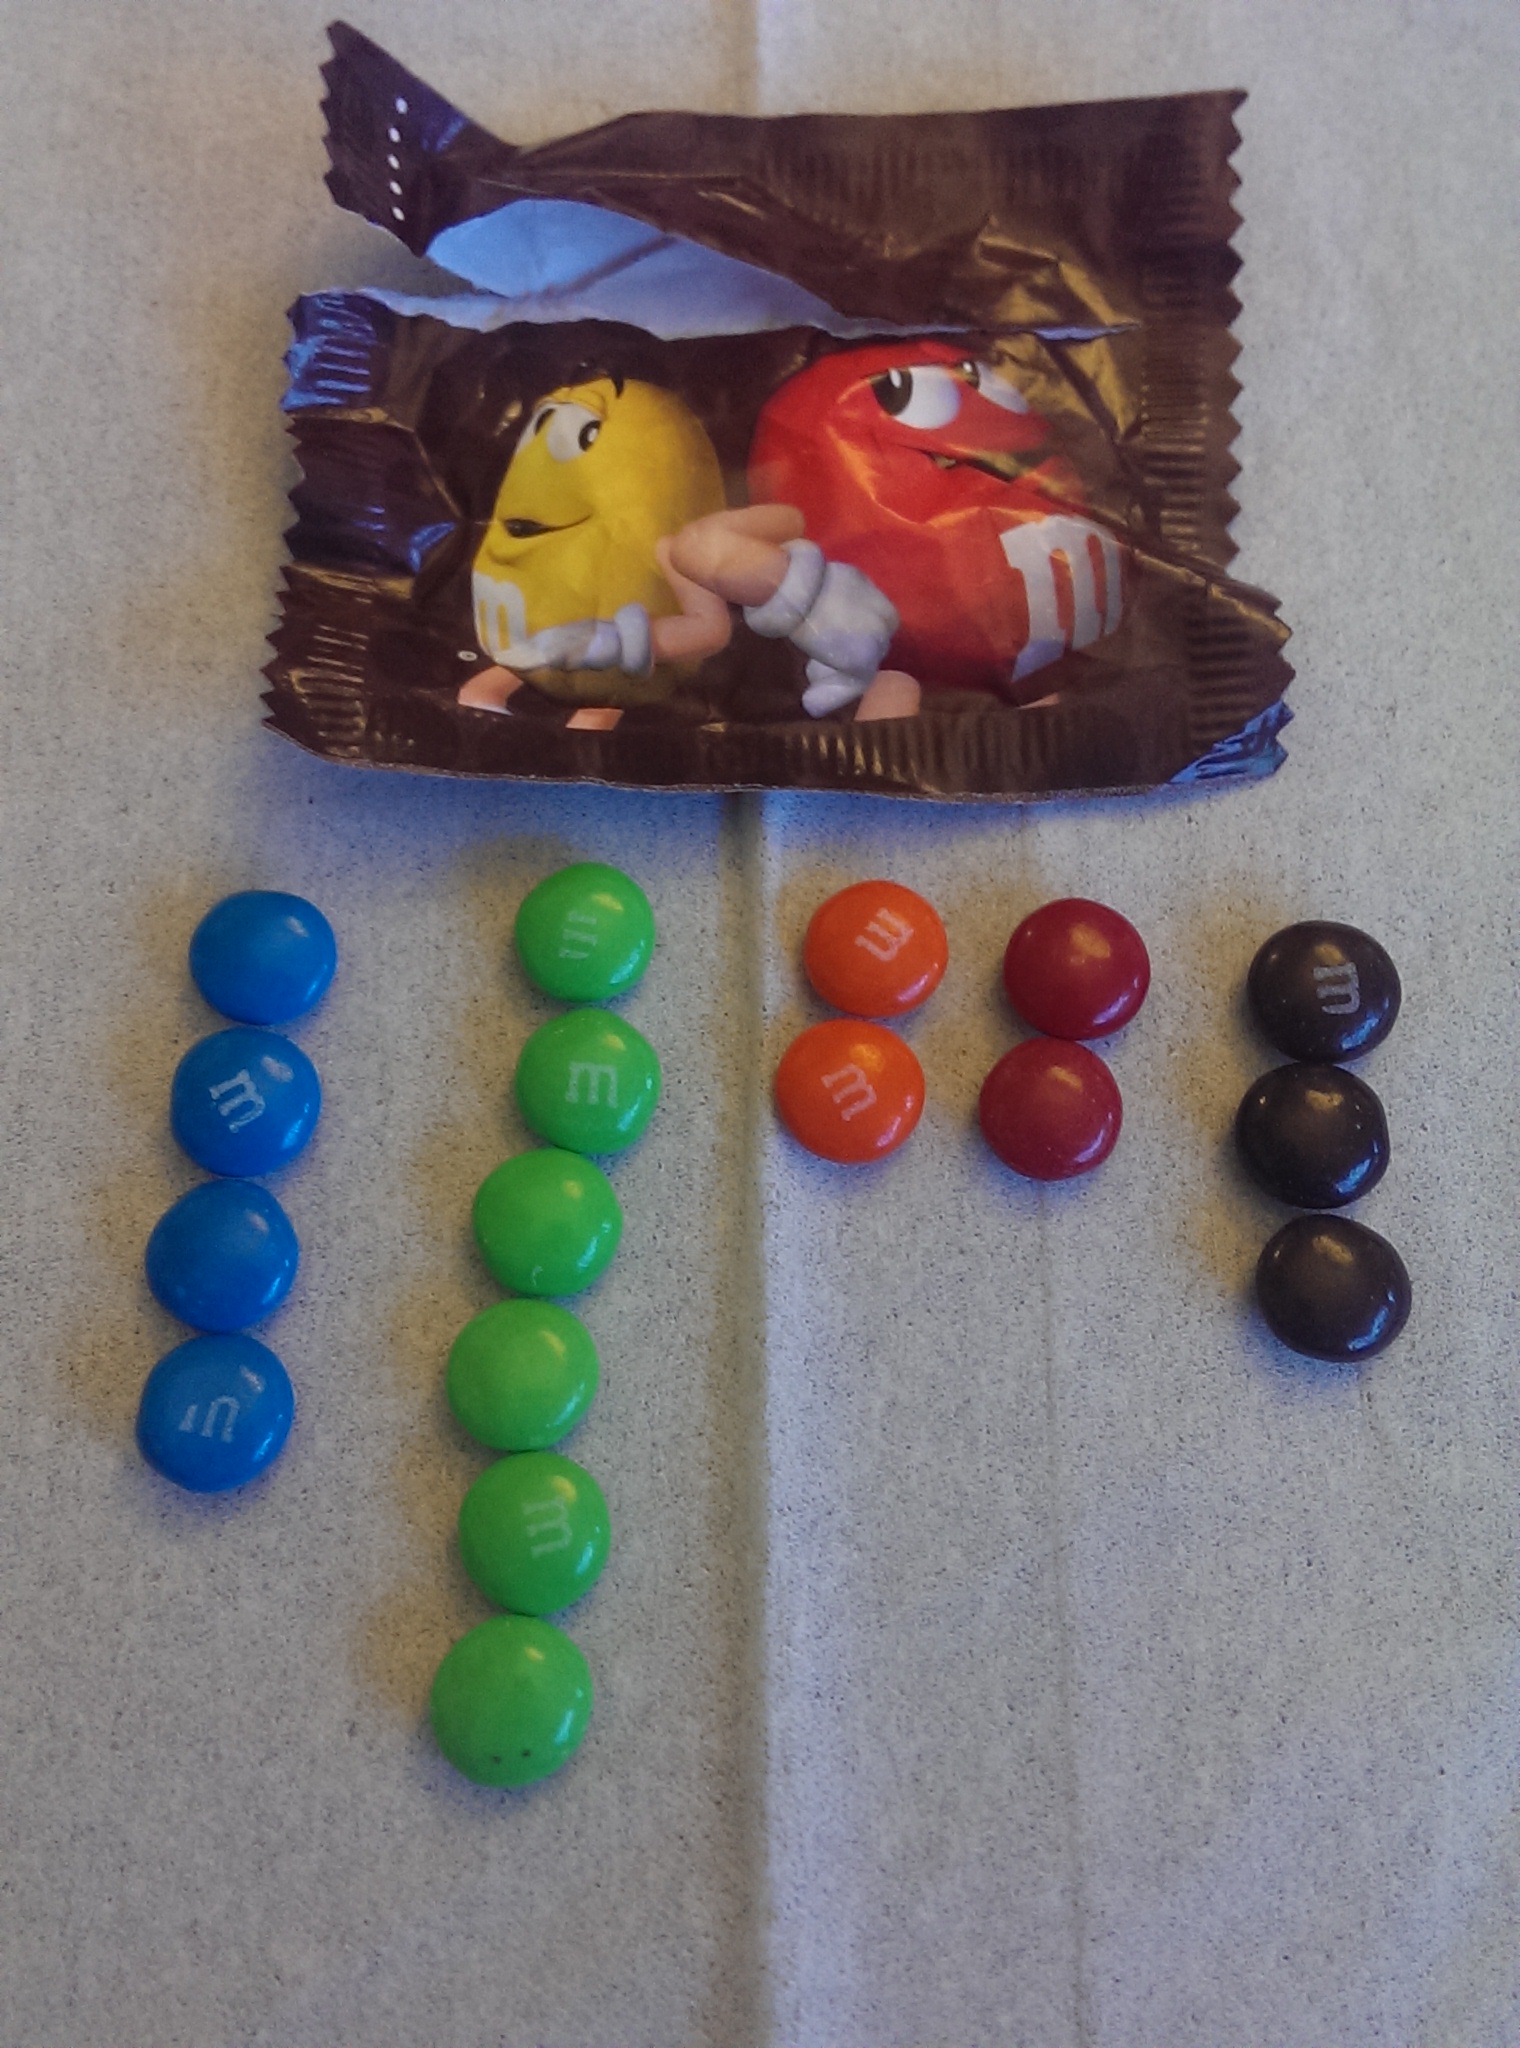
I’m told that there are treatments available for those of us who are compelled like to count and sort our candy by color before eating it. I can stop any time I want, of course, but today’s fun-sized pack of M&Ms gave me pause.

No yellow. There’s a yellow guy on the package, but he’s a peanut M&M. Do the regular chocolate ones still come in yellow? Yes, they do, but not in this pack. What are the odds?
Well, assuming that the little packages are filled from an effectively bottomless vat of M&Ms representing the official color distribution (24% blue, 14% brown, 16% green, 20% orange, 13% red, and 14% yellow) and that every fun-sized pack has 17 candies like this one, the odds of no yellow should be (1-p(yellow))^17, or 0.84^17, which is about 5.16%.
In a much more rigorous and costly investigation, the estimable Josh Madison bought 48 packages (larger than mine, each had an average of 55 candies) of M&Ms and ran the numbers. No word on the number of pepcid tablets he needed, but not one of this 48 bags was bereft of any single color. Madison did, however, find that the actual distribution in his sample was not so close to the published ratio, with a lot less blue and more of all the others, especially green.
On the off chance that you’re still with me, I bet you’re wondering, “ok, professor chocoholic OCD, is there something I can use here?” Well, I think there are two ideas worth remembering if you’re in the business of counting or estimating or forecasting things:
Size Matters. Sample size, that is. If you based your view of the M&M world on my single 17-candy packet, you’d have a pretty messed up view of reality. If you used one of Josh’s 55-candy packs, you’d be a lot better off, but even with 48 such packs, you’d have only partially cracked the code.
Seemingly Rare Events aren’t always as rare as you think. Intuitively, a small pack of M&Ms missing a color feels like a rare thing – how often have you seen it? But the math puts it at 5%, one pack in 20. Huge businesses are built on the preferences of market segments smaller than 5% of the population. The United States contains about 4.5% of the world’s people. And sometimes rare events are even rarer than you think. What are the odds of picking up a fun-sized pack that’s all blue (the most common color by the official stats)? Do you think that would be 100 times rarer, maybe 10,000 times less common than no yellow? How about 0.0000000029% or about 1 all-blue pack in 34 billion, compared to 1 pack in 5 for yellow-deficiency? If all 400 million M&Ms made each day were put into 17-candy packs, they’d make only 8.5 billion packs a year. That would be a rare event.
The odds of a rare event happening are 1.0 after it happens. No matter how crazy it might seem, events with long odds can happen, and once they happen, they have happened. You could choose to believe something’s not right in your calculations or in the world, and you’d probably be smart to check. But once the all-blue pack is in your hands, there it is. Just remember that the odds of getting another one are just as small as they were before.
So think hard next time you put M&Ms into some kid’s trick or treat bag. Who knows what might happen?